ADX - Average Directional Movement Index
Average Directional Index was developed by J. Welles Wilder and is described in his 1978 book “New Concepts In Technical Trading Systems”. Average directional index (ADX) is a technical indicator used to determine the strength of a trend. ADX varies from 0 to 100. ADX is non-directional; it registers trend strength whether the price is trending up or down. Below table shows the strength of trend with ADX values.
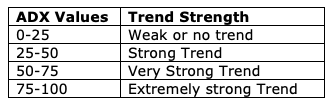
It is unlikely that ADX value would cross above 60.
As the ADX itself doesn’t show the direction of the trend, it is combined with Directional Index (+DI and -DI) to identify the direction of the trend. If +DI is above –DI, the trend is bullish and Bearish trend when –DI is higher than +DI.
Directional Movement Index (+DI and -DI):
The trend can be either up or down, and this is shown by two accompanying indicators, the Negative Directional Indicator (-DI) and the Positive Directional Indicator (+DI). Therefore, ADX commonly includes three separate lines. These are used to help assess whether a trade should be taken long or short, or if a trade should be taken at all.
Computation of +DI and –DI:
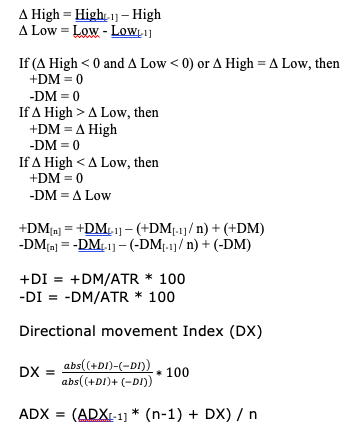
Default smoothing period for +DI, -DI, ATR and ADX is 14. Smoothing periods can be increased to avoid whipsaws.
Average Directional Movement Rating (ADXR):
Average Directional Movement Rating is the average of the two ADX values. The ADXR smoothness the ADX, and is therefore, less responsive and filters out excessive tops and bottoms.
![]()
Generally, ADX and ADXR is used to identify trend and take position in the direction of trend identified by +DI or –DI.
Entry Long:
ADX Higher than 25
And +DI Higher than -DI
Exit Long:
+DI Crosses below –DI
Entry Short:
ADX Higher than 25
And -DI Higher than +DI
Exit Short:
-DI Crosses below +DI