CMO - Chande Momentum Oscillator
Developed by Tushar Chande, Chande Momentum Oscillator (CMO) helps to identify overbought and oversold levels similar to the Relative Strength Index (RSI).
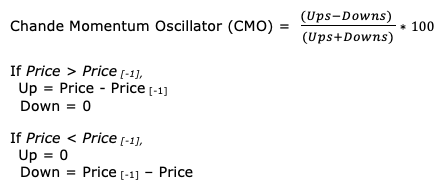
Ups = Sum(Up, n periods)
Downs = Sum(Downs, n periods)
n is the number of lookback period. The default value of n is 9.
Chande Momentum Oscillator would range between -100 to +100. Values above +50 indicate overbought and values below -50 indicates oversold levels. CMO can be smoothened by a moving average and a CMO crossover CMO Moving average could generate a buy signal and CMO cross below CMO Moving average would generate a sell signal.
Chande Momentum Oscillator to be used differently in different market scenarios. In a range-bound price movement, one can use CMO to go long by taking a position when CMO is oversold or CMO crosses above -50 and exit with a few pips target or when CMO get in overbought zone (crosses above +50) or cross below 0 or -50 to exit on stops. A reverse strategy could be adopted for shorting.
On a trending market, CMO could help to identify entry points i.e., on a bullish trend identifying oversold (CMO crossing above -50) levels to take entry and follow the trend for exit or selling on divergence (CMO crossing below +50) and vice versa for a bearish trend.
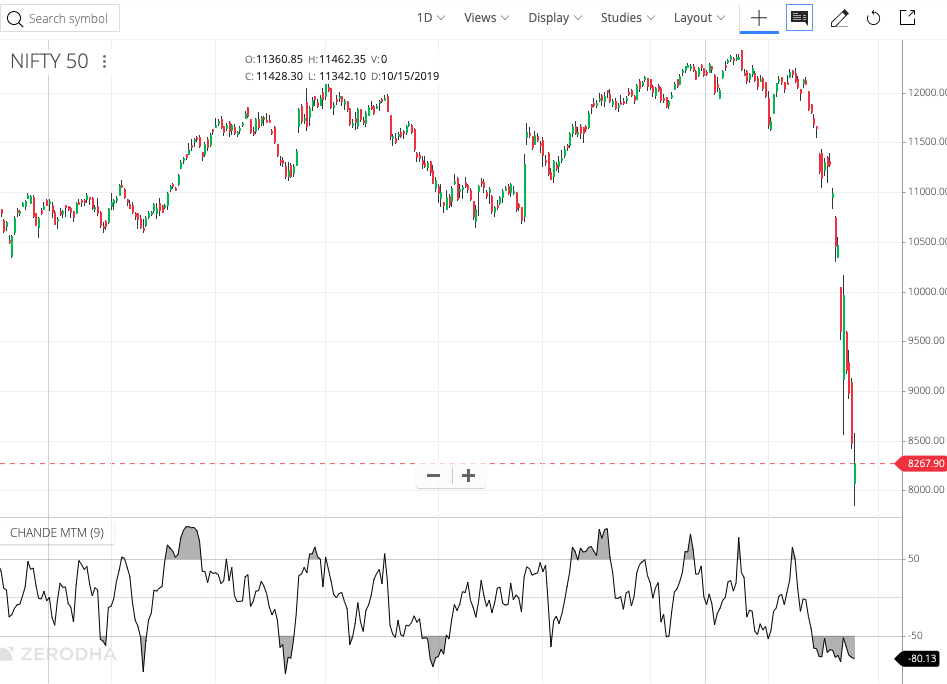
CMO on Nifty 50 chart with overbought and oversold levels.