AROON – Aroon:
Developed by Tushar S. Chande, Aroon indicator identifies the change in Trend of an instrument as well as the strength of the trend. The indicator consists of two lines (Up and Down) that measure how long it has been since the highest high or lowest low has occurred over a time period.
Values of Aroon varies between 0 to 100 and when Aroon Up is above Aroon Down, indicates an upward trend and downtrend when Aroon Down is above Aroon Up. A strong upward trend is indicated when the Aroon Up is above 70 while the Aroon Down is below 30. Likewise, a strong downward trend is indicated when the Aroon Down is above 70 while the Aroon Up is below 30. Also, look for crossovers indicating the trend reversal.
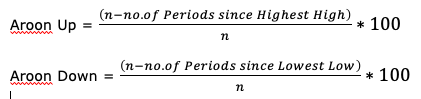
n is number of lookback periods (typical 25 periods)
Aroon tracks the highs and lows for the last n periods and notes the number of periods since last high and low.
As Aroon focuses on last n periods, Aroon Up reading above 50 means the price made a new high within the last n/2 periods. Aroon Up near 100 means high was seen very recently. The same applies to Aroon Down.
AROONOSC - Aroon Oscillator
Aroon Oscillator is calculated by subtracting the Aroon Down from the Aroon Up. The resultant number will oscillate between -100 and +100. Aroon Oscillator above 0 indicates an uptrend meaning Aroon Up is higher than Aroon Down and vice versa for a downtrend. Aroon Oscillator crossing zero indicates the trend reversal. To avoid whipsaws and capture big moves trades use the crossover of +50 for bullish trend while crossing below -50 signifies bearish trend. When the Up and Down are approximately equal, the Aroon Oscillator will hover around zero, indicating a weak trend or consolidation.
Aroon and Aroon Oscillator on Chart

Source: Tradingview
Creating Screener from Aroon
Screen conditions on NSE fifty for long with a strong uptrend.

Creating Strategy with Aroon
