CCI - Commodity Channel Index
Developed by Donald Lambert, The Commodity Channel Index (CCI) is designed to detect the beginning and ending market trends, and overbought and oversold levels. It measures the difference between the current price and the historical average price. CCI value above 100 indicates that the price is well above the historic average and has upside strong trend and CCI below -100 indicates strong downside trend.
Commodity Channel Index can go higher or lower indefinitely. Hence, overbought and oversold levels are typically determined for each individual instrument by looking at historical extreme CCI levels where the price reversed from.
One can also look for price divergence in the Commodity Channel Index. If the price is making new highs, and the CCI is not, then a price correction is likely.
![]()
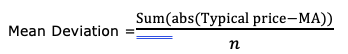
Typical Price = Sum of ((high + low + close)/3, n periods)
Moving Average (MA) = SMA(Typical Price, n periods)
CCI can also be combined with other trend-following indicators to make scalping trades in the direction of the trend, by capturing oversold CCI levels (CCI crossing above -100) in case of the bullish trend and vice versa for a bearish trend. This technique can also be used to identify the entry point to get into the trend.
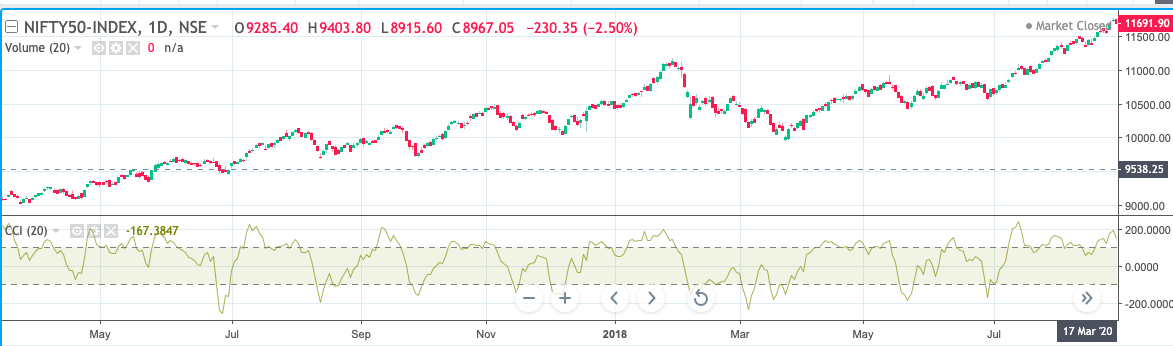
In the above chart of nifty in trending market, with the help of CCI, one could have got an entry point when CCI crosses above -100 - some points are June 17, Aug 17, Oct 17… etc.
It can also be used to identify oversold and overbought zones.