Moving Averages are widely used technical indicators to smoothen the price by filtering out “noise” from short-term price fluctuations and identify trends. They also help determine support and resistance levels.
Moving averages are mostly lagging indicators as they are based on past prices; the longer the time period for the moving average, the greater the lag.
Use cases of moving averages:
Moving averages help to determine trend direction. Prices above moving averages indicate an upward or bullish trend and a downward or bearish trend when prices are below the moving average.
Moving averages can also indicate support and resistance areas. A rising moving average tends to support the price action, while a falling moving average tends to provide resistance to price action. This strategy reinforces the idea of buying when the price is near the rising MA or selling when the price is near the falling average.
There are few moving averages which are generally more sensitive to price movement and few are lagging. This can be a double-edged sword. On one side, sensitive Moving Averages can identify trends sooner than a lagging average. On the flip side, price-sensitive Moving Averages will probably experience more whipsaws than a corresponding lagging Moving Averages.
Golden Crossover:
A golden cross is a bullish breakout pattern formed from crossing (from below) of a short-term moving average (50 days) over long-term moving average (200days).
Below are the conditions that can be used to enter and exit position using moving averages.
Entry Long:
Moving Average(50) Crosses above Moving average (200)
Exit Long:
Moving average(50) Crosses above Close
Or
Moving Average(50) Crosses below Moving average (200)
Entry Short:
Moving Average(50) Crosses below Moving average (200)
Exit Short:
Moving average(50) Crosses below Close
Or
Moving Average(50) Crosses above Moving average (200)
There are various types of moving averages, explained below.
1. Simple Moving average (SMA)
Simple moving averages takes the arithmetic mean of a given set of prices over the previous n periods, for example over the previous 15, 30, 100, or 200 days. In SMA each price in a time period caries equal weight, and prices outside the time period are not included in the average.
![]()
P = Prices
n = period or number of days
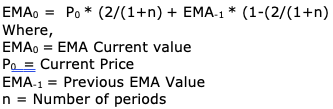
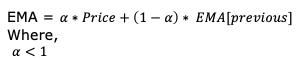
2. Exponential Moving average (EMA)
As compared to Simple moving average, Exponential moving average is a cumulative calculation including all prices. Older prices have diminishing contribution while the most recent prices have greater weight. This allows the moving average to be more responsive to changes in prices.
3. Double Exponential Moving average (DEMA)
Double Exponential moving average reduces the lag in moving averages by placing more weight on recent prices.
DEMA = 2 * EMA – EMA(EMA)
4. Triple Exponential Moving average (TEMA)
Triple Exponential moving average(TEMA) further reduces the lag in moving averages as compared to EMA and DEMA.
TEMA = (3 * EMA) – (3 * EMA(EMA)) + EMA(EMA(EMA))
5. T3 – The Triple Exponential Moving Average (T3)
T3 is a smoothing function based on DEMA. T3 smoothens the price data by Normalizing DEMA (ND) by three times. DEMA is Normalized by multiplying a factor which ranges between 0 and 1. T3 typically uses a factor of 0.7.
ND = EMA(Period) * (1+factor) – EMA(EMA(Period)) * factor
T3 = ND(ND(ND(Period)))
6. MidPoint over period
It is the average of the highest value and lowest value over a period.
MidPoint = (Highest Value (period) + Lowest value (Period))/2
7. MidPrice over period
It is the average of (high + low)/2 over a period.
MidPrice = Average((High + Low)/2,(period))
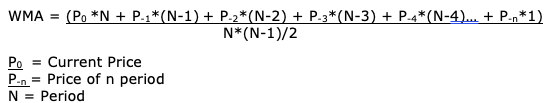
8. WMA - Weighted Moving Average
Weighted moving average puts more weights on recent prices and less on older price data. WMA multiplies each price by a weighing factor.
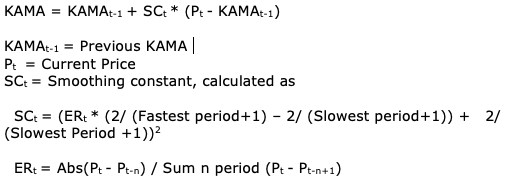
9. KAMA - Kaufman Adaptive Moving Average
Kaufman’s Adaptive Moving Average (KAMA), developed by Perry Koufman, is based
on the concept that a noisy market requires a slower trend than one with less noise. With KAMA low noise price patterns would have a faster moving average trend as compared to high noise price patterns.
KAMA is designed to use the fastest trend possible based on the smallest calculation period for the existing market conditions. It varies the speed of the trend by changing the smoothing constant each period. The use of a smoothing constant was selected because it allows for a full range of trends, represented as percentages.
Default values:
Slowest Period = 30
Fastest period = 2
Efficiency ratio (ER) period = 10
Efficiency ratio(ER) varies between 0 and 1. When the price moves up or down for ER (10) consecutive period, ER is 1 and when the price remains unchanged for 10 consecutive period ER is 0.
10. MAMA - MESA Adaptive Moving Average
The MESA Adaptive Moving Average (MAMA) adapts to price movement based on the rate change of phase as measured by the Hilbert Transform Discriminator. This method of adaptation features a fast and a slow-moving average so that the composite moving average swiftly responds to price changes and holds the average value until the next bar’s close. The starting for MAMA is the EMA
The concept of MAMA is to relate the phase rate of change to EMA Alpha, thus making EMA adaptive. The alpha in MAMA range between the maximum (Fast limit) of 0.5 and minimum (slow limit) of 0.05.
A Following Adaptive moving average (FAMA) emerge if MAMA is applied to the first MAMA line. MAMA and FAMA do not cross unless there is a major change in market direction. Hence, making adaptive moving average crossover system that is virtually free of whipsaw trades.
11. MAVP - Moving average with variable period
Developed by Tushar Chande, Variable Moving Average is an exponential moving average that automatically adjusts the smoothing weight based on the volatility of the price. In times of low volatility, trending prices, the moving average time period is shorter to be sensitive to the inevitable break in the trend. Whereas, in more volatile non-trending times, the moving average time period is longer to filter out the choppiness.
Variable Moving Average uses 9-period Chande Momentum Oscillator (CMO) to calculate volatility.
![]()
CMO is Chande’s Momentum Oscillator for 9 periods. Refer CMO Indicator for details.
12. TRIMA - Triangular Moving Average
The Triangular Moving Average is a Weighted Moving Average assigning the weights in a triangular pattern. A 7-period Triangular Moving Average would have weights in 1, 2, 3, 4, 3, 2, 1 pattern. Hence, TEMA gives more weight to the middle of the time series and less weight to the oldest and newest data.
![]() when n is even
when n is even
![]() when n is odd
when n is odd
-----------------------------------------------------------------------------------------------------------------------------
Other indicators which are dependent on Moving averages are Price Oscillator and Range Action Verfication Index