Here are the two most commonly used trend-following indicators. They are best suited in trending market and can ride the trend until it indicates the reversal. If you don’t know when to exit a trending stock, they can provide you with the exit points.
SAR – Stop and Reverse:
The Parabolic SAR calculates a trailing stop. Simply exit when the price crosses the SAR. The SAR assumes that you are always in the market, and calculates the Stop And Reverse point when you would close a position and open a new position.
![]()
AF = Acceleration Factor of 0.02 with an increment by 0.02 each time interval until it reaches 0.2.
Selects High price when in Long position and Low price when in short position.
Parabolic SAR plotted with dotted lines in the below graph.
Super Trend:
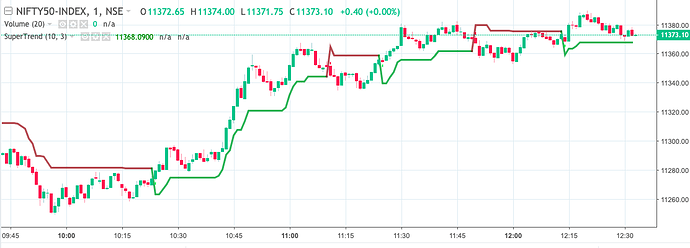
Super Trend is a Trend following indicator similar to Stop and Reverse (SAR) and assumes that you are always in the market. It helps to ride the trend once it is established.
Super Trend uses either Upper Band or Lower Band which is calculated using ATR times constant multiplier. The default value of the multiplier is 3 and period to calculate ATR is 14. It means the Band values are 3 (multiplier) times ATR away from the price. ATR is Average True Range, refer ATR section for its calculations.
The super trend indicates taking a long position when it takes lower band values and indicates taking a short position when the Super trend takes Upper band values.
Redline for upper band indicating a bearish trend and greenline for lower band indicating a bullish trend.

