The relative strength index (RSI), developed by J. Welles Wilder measures the magnitude of recent price changes to evaluate overbought or oversold conditions. The value of RSI varies between 0 to 100. RSI above 70 represents an overbought zone and below 30 represents the oversold zone for a stock.
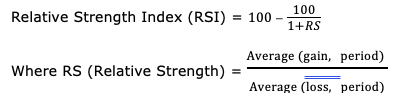
The default lookback period is 14.
RSI would rise when the number and size of gains increases and fall when the number of losses increases. RSI would be closer to 100 in a strong bullish market and close to 0 in a strong bearish market.
RSI can also signal divergence. A bullish divergence appears when the RSI forms two rising lows that correspond with two falling lows on the price, and a bearish divergence appears when the RSI forms two falling highs which correspond with two rising highs in the price.
Relative strength index is a lagging indicator and can provide false signals. In a bullish market, an RSI Cross below oversold level (70) could be a false signal for trend reversal and vice versa. In a trending market RSI signal are most reliable when they confirm to long-term trend. RSI can provide good signals in an oscillating or in a ranging market.
Traders also use RSI to identify the trends to invest. RSI above 50 indicates a bullish trend and be invested in it till RSI crosses below 50 and vice versa for a bearish trend.
